Multichannel Pulse Height Analyzer
Interesting links
Some interesting links on radiation spectroscopy:
- Digital signal processing for BGO detectors
- Digital gamma-ray spectroscopy based on FPGA technology
- Digital signal processing for segmented HPGe detectors
- FPGA-based algorithms for the stability improvement of high-flux X-ray spectrometric imaging detectors
- Spectrum Analysis Introduction
Hardware
This application requires the Zmod Digitizer module to be connected to the ZMOD A connector of the USB104 A7 board.
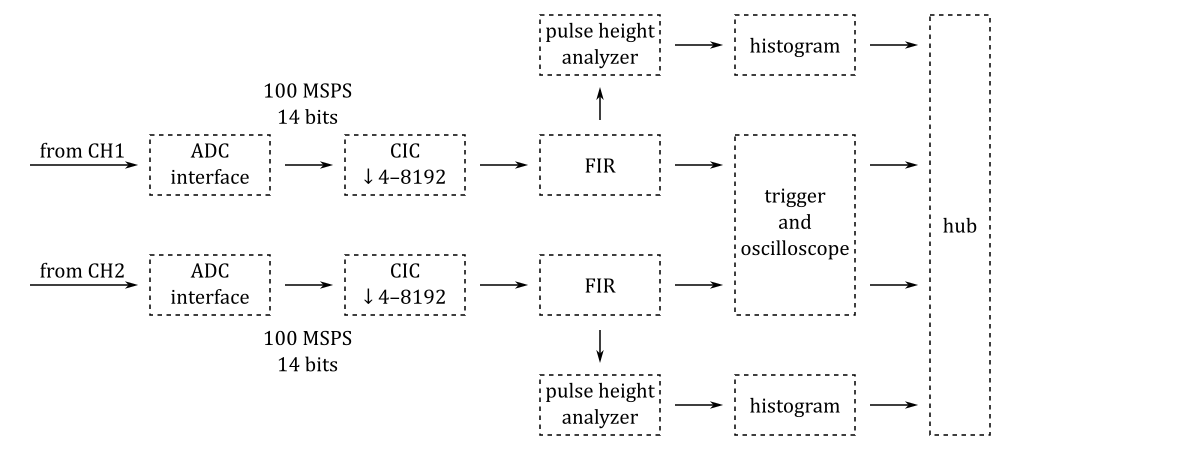
This system is designed to analyze the height of Gaussian-shaped pulses and it expects a signal from a pulse-shaping amplifier. It is also known to work with non-overlapping exponentially rising and exponentially decaying pulses.
The basic blocks of the system are shown in the following diagram:

The width of the pulse at the input of the pulse height analyzer module can be adjusted by varying the decimation factor of the CIC filter.
The baseline is automatically subtracted. The baseline level is defined as the minimum value just before the rising edge of the analyzed pulse.
The embedded oscilloscope can be used to check the shape of the pulse at the input of the pulse height analyzer module.
The projects/mcpha directory contains four Tcl files: block_design.tcl, pha.tcl, hst.tcl, osc.tcl. The code in these files instantiates, configures and interconnects all the needed IP cores.
The source code of the R script used to calculate the coefficients of the FIR filter can be found in projects/mcpha/filters/fir_0.r.
Software
The projects/mcpha/ui directory contains the source code of the control program (mcpha.py).

Getting started
- Connect a signal source to the CH1 or CH2 connector of the Zmod Digitizer module
- Connect the USB104 A7 board to a USB port
- Download and unpack the release zip file
- Install the WinUSB driver for the USB interface of the USB104 A7 board (USB ID
0403:6010and0403:6014) using Zadig - Run the
mcpha.exeprogram - Press the Start button in the upper left corner
- Select the Spectrum histogram 1 or Spectrum histogram 2 tab
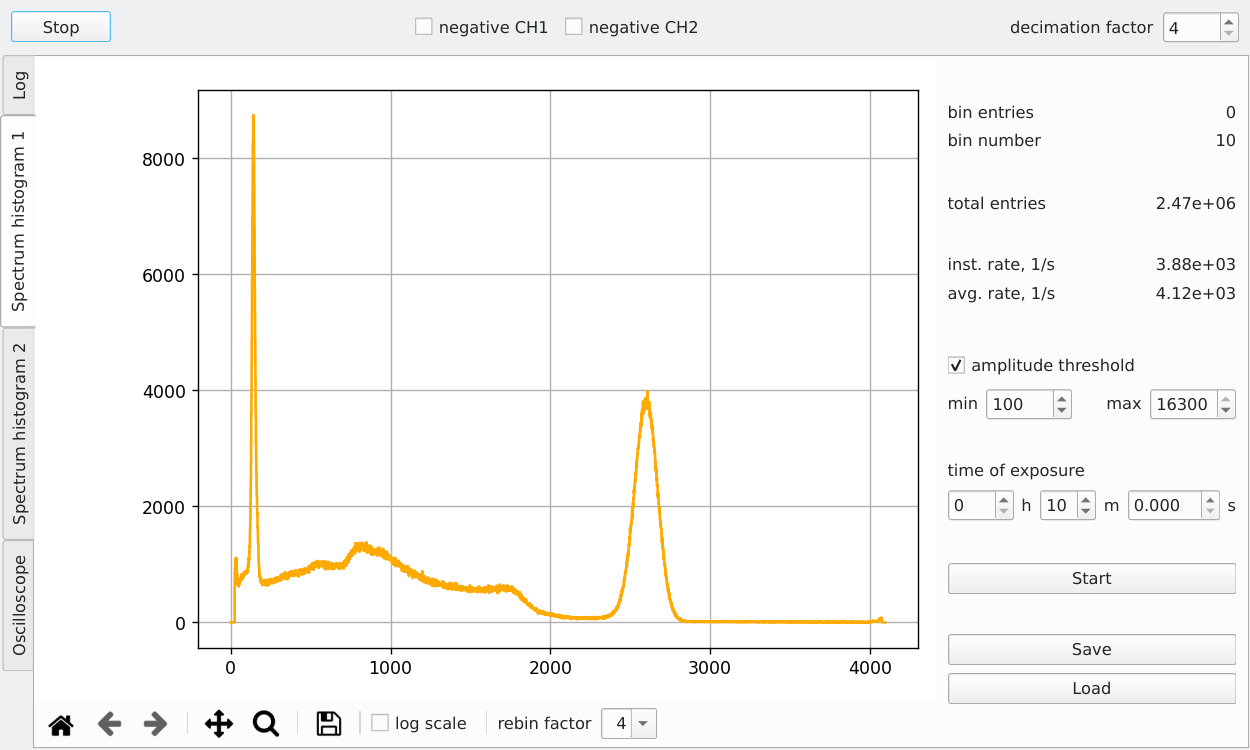
- Set the amplitude threshold and exposure time
- Press the Start button on the Spectrum histogram tab
Building from source
The structure of the source code and of the development chain is described at this link.
Setting up the Vitis and Vivado environment:
source /opt/Xilinx/2025.1/Vitis/settings64.shCloning the source code repository:
git clone https://github.com/pavel-demin/usb104-a7-notes
cd usb104-a7-notes
Building mcpha.bit:
make NAME=mcpha bitConfiguring the FPGA:
make NAME=mcpha run